Features
Documentation
Download
Easy. Simple.
Just one API function to learn and master, for all your charting needs.
Customizable.
More than 101 ways to make each chart unique and to let you bring your data to life.
Extensible.
Extend your chart further by writing code on top of d3 selections exposed in each chart.
Free. Open Source.
Free to use and extend.
Under MIT License
Features
Simple
Simple to learn and use
Robust and powerful
Uniform data representation
Customizable
100+ Configuration options
12 supported chart types
Support for multiple scales
Extensible
Harness the power of d3.js
Active development community
Clientside 'Save as PNG' ability
Want a new feature or found a bug, do raise a request/issue at
Github Issue Tracker
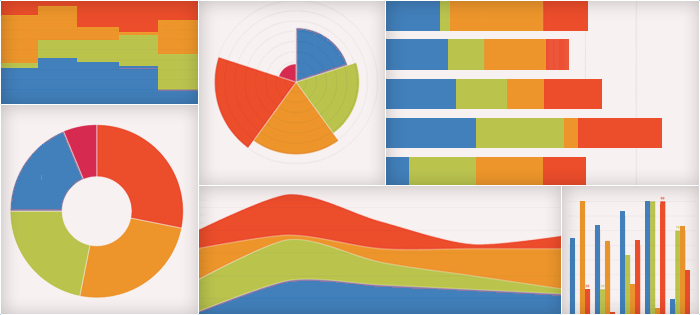
Charts
We have all your basic charting needs covered and we're busy brewing more.
Bar Chart
Stacked Bar Chart
Step Up Bar Chart
Percent Bar Chart
Area Chart
Stacked Area Chart
Percent Area Chart
Line Chart
Pie Chart
Donut Chart
Polar Area Chart
Waterfall Chart
Want to use uvCharts in your project? Get started
here